1. Network Observability with Hubble
- Hubble의 역할과 구조
- Cilium과 eBPF 위에 구축된 완전 분산형 네트워킹·보안 관측 플랫폼
- 서비스 간 통신, Pod → 호스트, 호스트 간 네트워크 동작을 투명하게 가시화
- eBPF 기반 동적 관측
- 커널 레벨 BPF 훅을 활용해 필요한 지점에서 프로그래밍 가능한 추적·필터링
- 오버헤드를 최소화하면서 세밀한 정보(패킷, 커넥션, 메트릭 등) 수집
- 관측 범위: 단일 노드에서 다중 클러스터까지
- 기본 Hubble API는 로컬 Cilium 에이전트가 설치된 노드에 한정된 트래픽 인사이트 제공
- Hubble Relay를 추가 배포하면 클러스터 메시 환경에서 노드·클러스터·클러스터 간 통합 가시성 확보
- Hubble API와 CLI
- Hubble API는 노드 내 UNIX 도메인 소켓으로 Hubble 데이터를 노출
- Hubble CLI는 이 소켓을 통해 로컬 에이전트에서 관찰된 이벤트·플로우를 조회
- Hubble Relay 활용
- Relay는 여러 노드의 Hubble 데이터를 모아 중앙에 집계
- 클러스터 메시 환경에서 단일 엔드포인트로 네트워크 흐름 분석 가능
- Hubble UI 기능
- 웹 기반 인터페이스로, L3/L4 수준은 물론 L7(HTTP, gRPC 등) 종속성을 자동 탐지
- 서비스 종속성 그래프 제공 및 플로우 필터링·탐색 지원
- 운영 시 고려사항
- 로컬 에이전트와 Relay 간 네트워크 통신, RBAC 권한 설정 필요
- 관측 대상 클러스터 규모·정책에 맞춰 eBPF 맵 크기·메모리 한계 조정
설치전 확인
cilium status
cilium config view | grep -i hubble
kubectl get cm -n kube-system cilium-config -o json | jq

#
kubectl get secret -n kube-system | grep -iE 'cilium-ca|hubble'
ss -tnlp | grep -iE 'cilium|hubble' | tee before.txt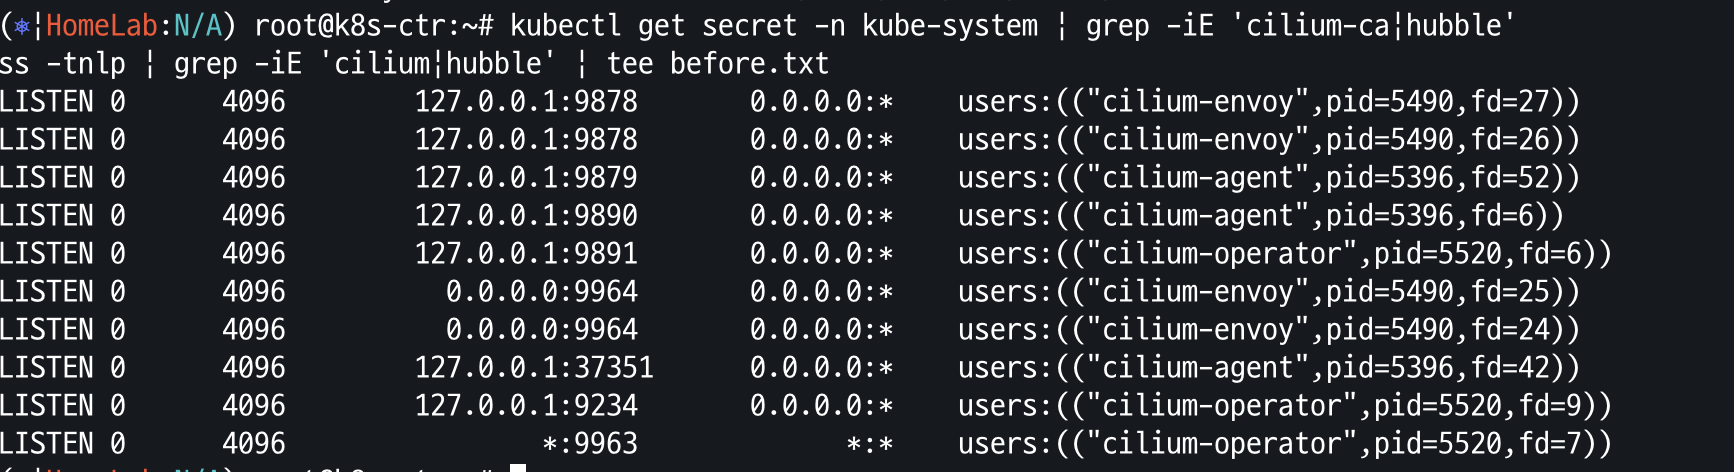
hubble 설치
설치 방법 2개
1. helm upgrade
helm upgrade cilium cilium/cilium --namespace kube-system --reuse-values \
--set hubble.enabled=true \
--set hubble.relay.enabled=true \
--set hubble.ui.enabled=true \
--set hubble.ui.service.type=NodePort \
--set hubble.ui.service.nodePort=31234 \
--set hubble.export.static.enabled=true \
--set hubble.export.static.filePath=/var/run/cilium/hubble/events.log \
--set prometheus.enabled=true \
--set operator.prometheus.enabled=true \
--set hubble.metrics.enableOpenMetrics=true \
--set hubble.metrics.enabled="{dns,drop,tcp,flow,port-distribution,icmp,httpV2:exemplars=true;labelsContext=source_ip\,source_namespace\,source_workload\,destination_ip\,destination_namespace\,destination_workload\,traffic_direction}"
2. hubble 활성화
# 설치방안 2 : hubble 활성화
cilium hubble enable
cilium hubble enable --ui
.Values.hubble.enabled = true 로 되어 있어야 함
설치 후 hubble 확인
cilium status
Hubble Relay:       OK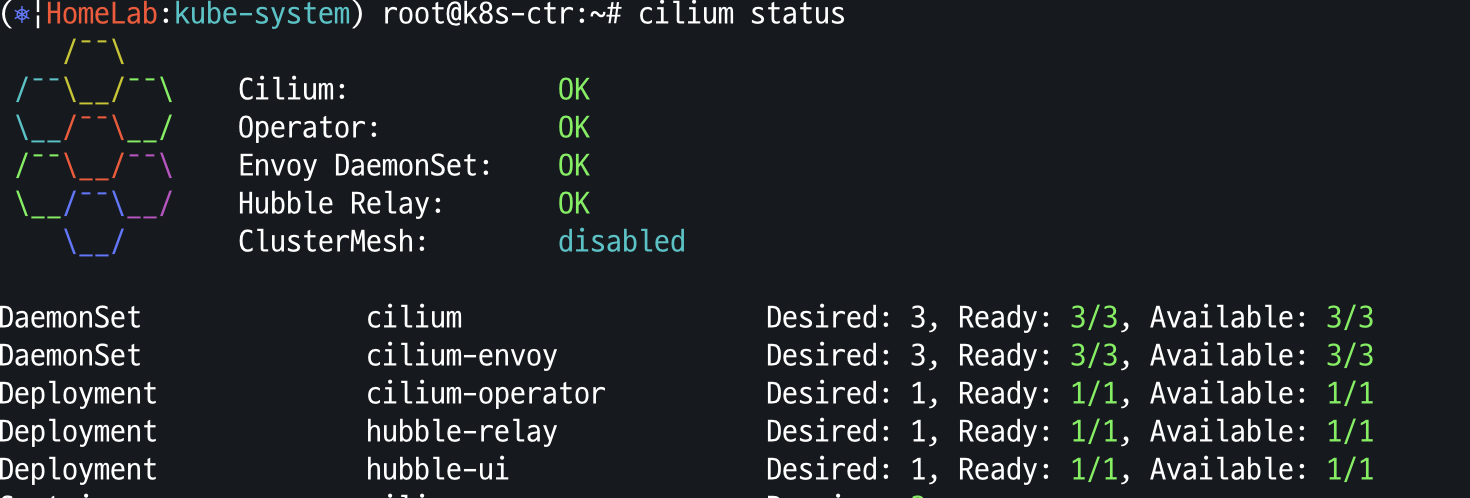
hubble 에서 필요한 4244 port enabled all node
cilium config view | grep -i hubble
kubectl get cm -n kube-system cilium-config -o json | grep -i hubble

#
kubectl get secret -n kube-system | grep -iE 'cilium-ca|hubble'

# # Enabling Hubble requires the TCP port 4244 to be open on all nodes running Cilium.
ss -tnlp | grep -iE 'cilium|hubble' | tee after.txt
vi -d before.txt after.txt
for i in w1 w2 ; do echo ">> node : k8s-$i <<"; sshpass -p 'vagrant' ssh vagrant@k8s-$i sudo ss -tnlp |grep 4244 ; echo; done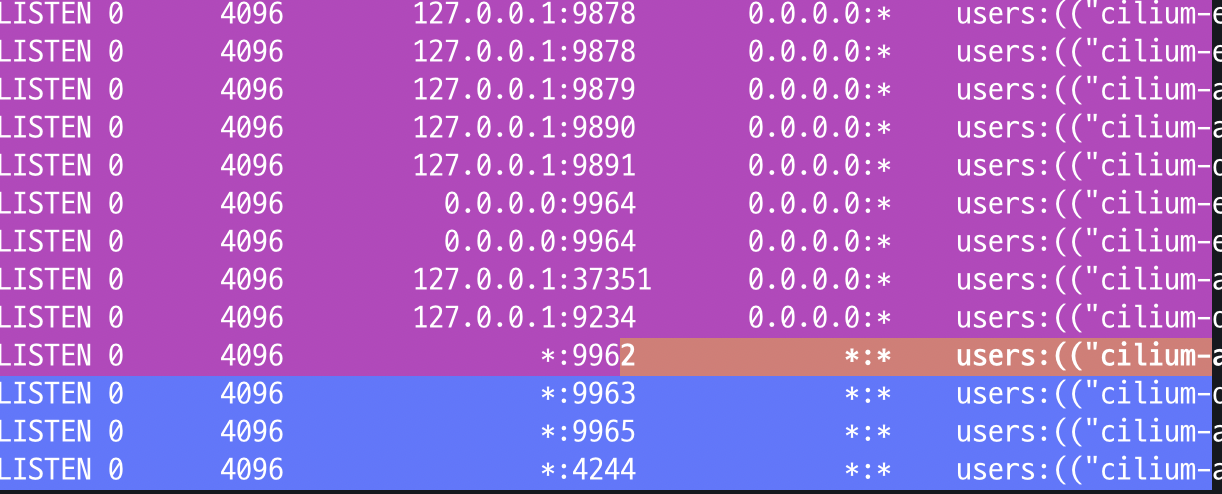
hubble ui 웹 주소 확인
NODEIP=$(ip -4 addr show eth1 | grep -oP '(?<=inet\s)\d+(\.\d+){3}')
echo -e "http://$NODEIP:31234"

hubble client 설치
# Linux 실습 환경에 설치 시
HUBBLE_VERSION=$(curl -s https://raw.githubusercontent.com/cilium/hubble/master/stable.txt)
HUBBLE_ARCH=amd64
if [ "$(uname -m)" = "aarch64" ]; then HUBBLE_ARCH=arm64; fi
curl -L --fail --remote-name-all https://github.com/cilium/hubble/releases/download/$HUBBLE_VERSION/hubble-linux-${HUBBLE_ARCH}.tar.gz{,.sha256sum}
sudo tar xzvfC hubble-linux-${HUBBLE_ARCH}.tar.gz /usr/local/bin
which hubble
hubble status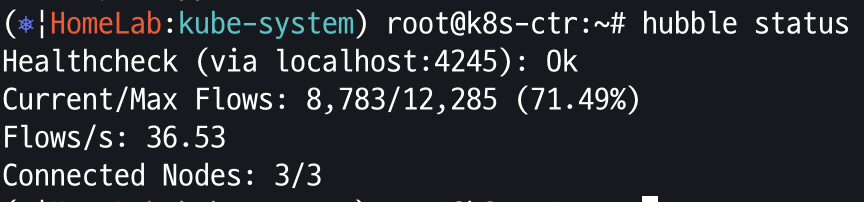
2. Running Prometheus & Grafana
- 모니터링
- 사전 정의된 메트릭(CPU·메모리·응답 시간 등)을 일정 간격으로 수집
- 임계값 초과 시 경고 발송해 시스템 건강 상태 감지
- 단일 서버나 잘 알려진 환경에서 간단하게 동작
- 관측 가능성(Observability)
- 로그·메트릭·트레이스(요청 흐름) 등을 통합 수집해 복잡한 동작까지 파악
- 미리 정의되지 않은 질문(“왜 이 요청이 실패했는가?”)에 답할 수 있는 유연성 제공
- 마이크로서비스·분산 시스템처럼 동적인 환경에서 필수
- 주요 차이점
- 목적: 모니터링은 ‘무엇이 잘못됐는지’ 감지, 관측 가능성은 ‘왜 잘못됐는지’ 진단
- 데이터 범위: 모니터링은 정형화된 메트릭, 관측 가능성은 로그·메트릭·트레이스 모두
- 시스템 복잡성: 모니터링은 단순 환경, 관측 가능성은 분산·동적 환경에 적합
- 상호작용 방식: 모니터링은 경고 기반, 관측 가능성은 동적 쿼리·분석 기반
Grafana 설치, Sample Application 설치
sampleApp 서ㄹ치
# 샘플 애플리케이션 배포
cat << EOF | kubectl apply -f -
apiVersion: apps/v1
kind: Deployment
metadata:
  name: webpod
spec:
  replicas: 2
  selector:
    matchLabels:
      app: webpod
  template:
    metadata:
      labels:
        app: webpod
    spec:
      affinity:
        podAntiAffinity:
          requiredDuringSchedulingIgnoredDuringExecution:
          - labelSelector:
              matchExpressions:
              - key: app
                operator: In
                values:
                - sample-app
            topologyKey: "kubernetes.io/hostname"
      containers:
      - name: webpod
        image: traefik/whoami
        ports:
        - containerPort: 80
---
apiVersion: v1
kind: Service
metadata:
  name: webpod
  labels:
    app: webpod
spec:
  selector:
    app: webpod
  ports:
  - protocol: TCP
    port: 80
    targetPort: 80
  type: ClusterIP
EOF


# k8s-ctr 노드에 curl-pod 파드 배포
cat <<EOF | kubectl apply -f -
apiVersion: v1
kind: Pod
metadata:
  name: curl-pod
  labels:
    app: curl
spec:
  nodeName: k8s-ctr
  containers:
  - name: curl
    image: nicolaka/netshoot
    command: ["tail"]
    args: ["-f", "/dev/null"]
  terminationGracePeriodSeconds: 0
EOF
배포 확인
# 배포 확인
kubectl get deploy,svc,ep webpod -owide
kubectl get endpointslices -l app=webpod
kubectl get ciliumendpoints
kubectl exec -it -n kube-system ds/cilium -c cilium-agent -- cilium-dbg endpoint list

# 통신 확인
kubectl exec -it curl-pod -- curl webpod | grep Hostname
kubectl exec -it curl-pod -- sh -c 'while true; do curl -s webpod | grep Hostname; sleep 1; done'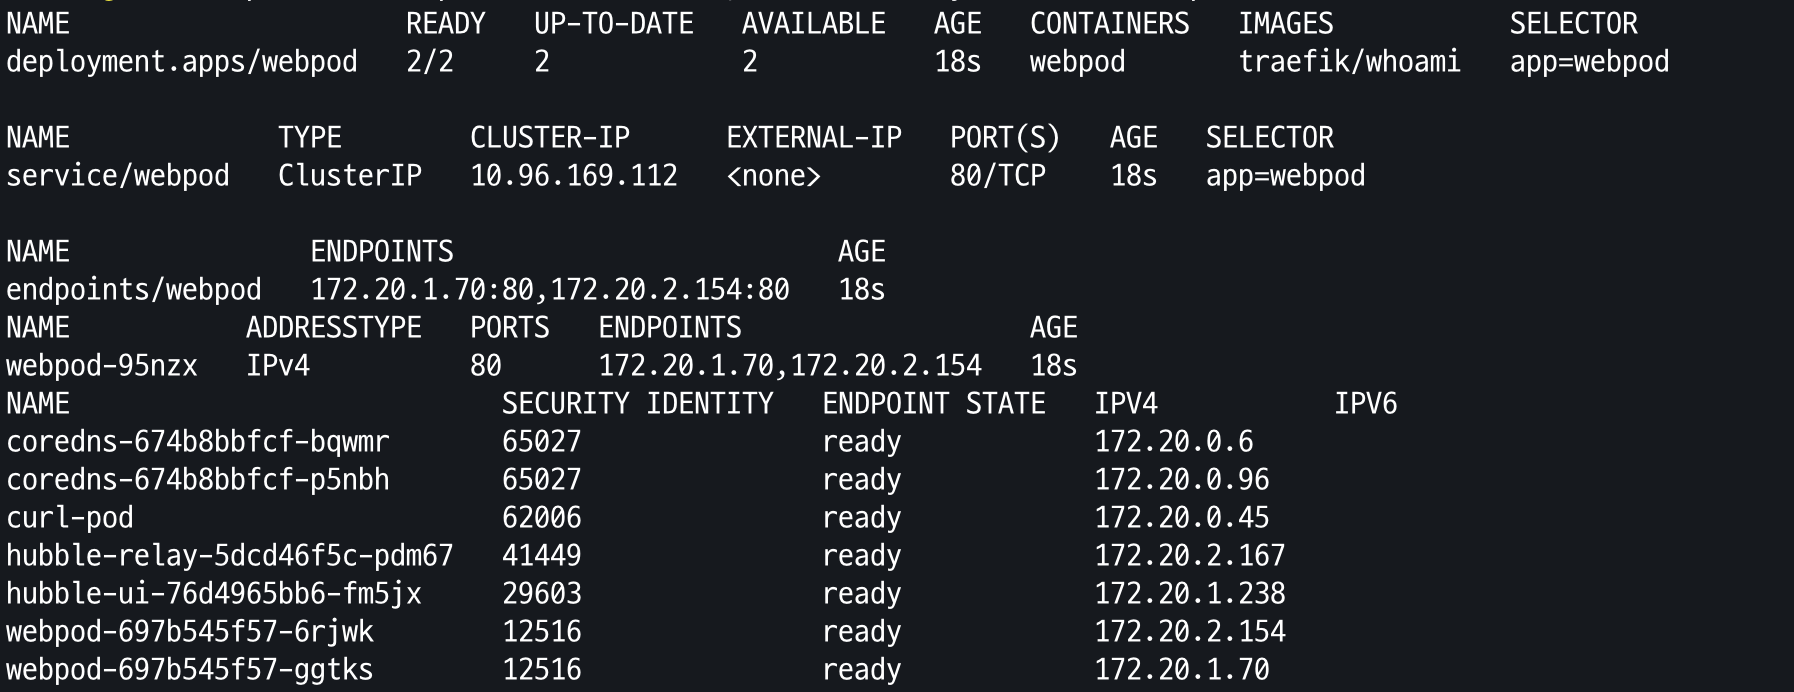
Prometheus & Grafana 설치
kubectl apply -f https://raw.githubusercontent.com/cilium/cilium/1.17.6/examples/kubernetes/addons/prometheus/monitoring-example.yaml
kubectl get deploy,pod,svc,ep -n cilium-monitoring
kubectl get cm -n cilium-monitoring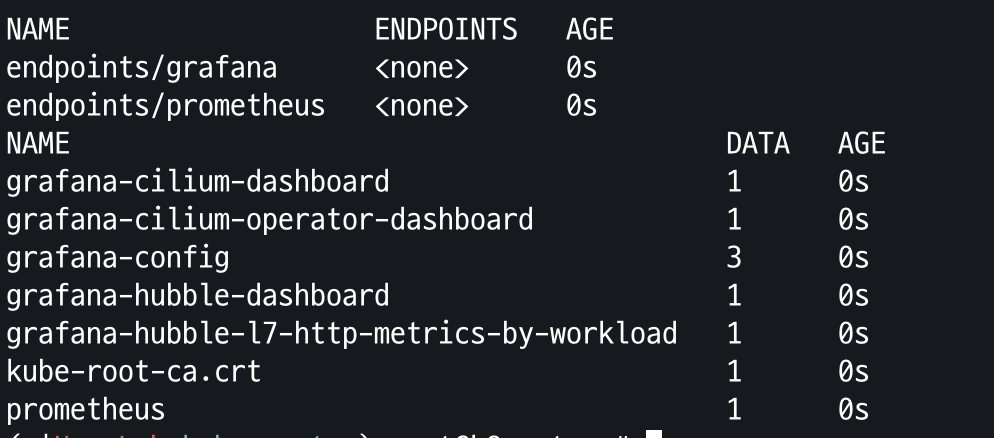
cilium Metric enable
- Cilium, Hubble, and Cilium Operator는 기본적으로 메트릭을 노출하지 않음
- Metric 활성화 하면 9962,9965,9963 포트가 Open
- Metric 설정
helm install cilium cilium/cilium --version 1.17.6 \
   --namespace kube-system \
   --set prometheus.enabled=true \
   --set operator.prometheus.enabled=true \
   --set hubble.enabled=true \
   --set hubble.metrics.enableOpenMetrics=true \
   --set hubble.metrics.enabled="{dns,drop,tcp,flow,port-distribution,icmp,httpV2:exemplars=true;labelsContext=source_ip\,source_namespace\,source_workload\,destination_ip\,destination_namespace\,destination_workload\,traffic_direction}"
Monitoring & Metrics
Cilium Metric 설정 및 수집 방법
- Cilium metrics은 Cilium 자체의 상태, 즉 Cilium Agent, Cilium envoy, Cilium operator 프로세스에 대한 인사이트를 제공
- 프로메테우스 메트릭이 활성화된 Cilium을 실행하려면 prometheus.enabled=true Helm 값 집합을 사용하여 Cilium을 배포
- Cilium metrics are exported under the cilium_ Prometheus namespace.
- Envoy metrics are exported under the envoy_ Prometheus namespace, of which the Cilium-defined metrics are exported under the envoy_cilium_ namespace.
- Kubernetes에서 실행 및 수집할 때 포드 이름과 네임스페이스로 태그가 지정
Cilium 설정
helm install cilium cilium/cilium --version 1.17.6 \
  --namespace kube-system \
  --set prometheus.enabled=true \
  --set operator.prometheus.enabled=true

# The ports can be configured via prometheus.port, envoy.prometheus.port, or operator.prometheus.port respectively.
--set prometheus.port
--set envoy.prometheus.port
--set operator.prometheus.port
활성화 확인
# cilium-agent 데몬셋 파드
kubectl describe pod -n kube-system -l k8s-app=cilium | grep prometheus
                      prometheus.io/port: 9962
                      prometheus.io/scrape: true

curl 192.168.10.100:9962/metrics


# cilium-operator 디플로이먼트 파드
kubectl describe pod -n kube-system -l name=cilium-operator | grep prometheus
Annotations:          prometheus.io/port: 9963
                      prometheus.io/scrape: true

curl 192.168.10.100:9963/metrics
Prometheus 는 Cilium 과 Enboy 메트릭을 scrape_configs section의 metric을 자동 수집
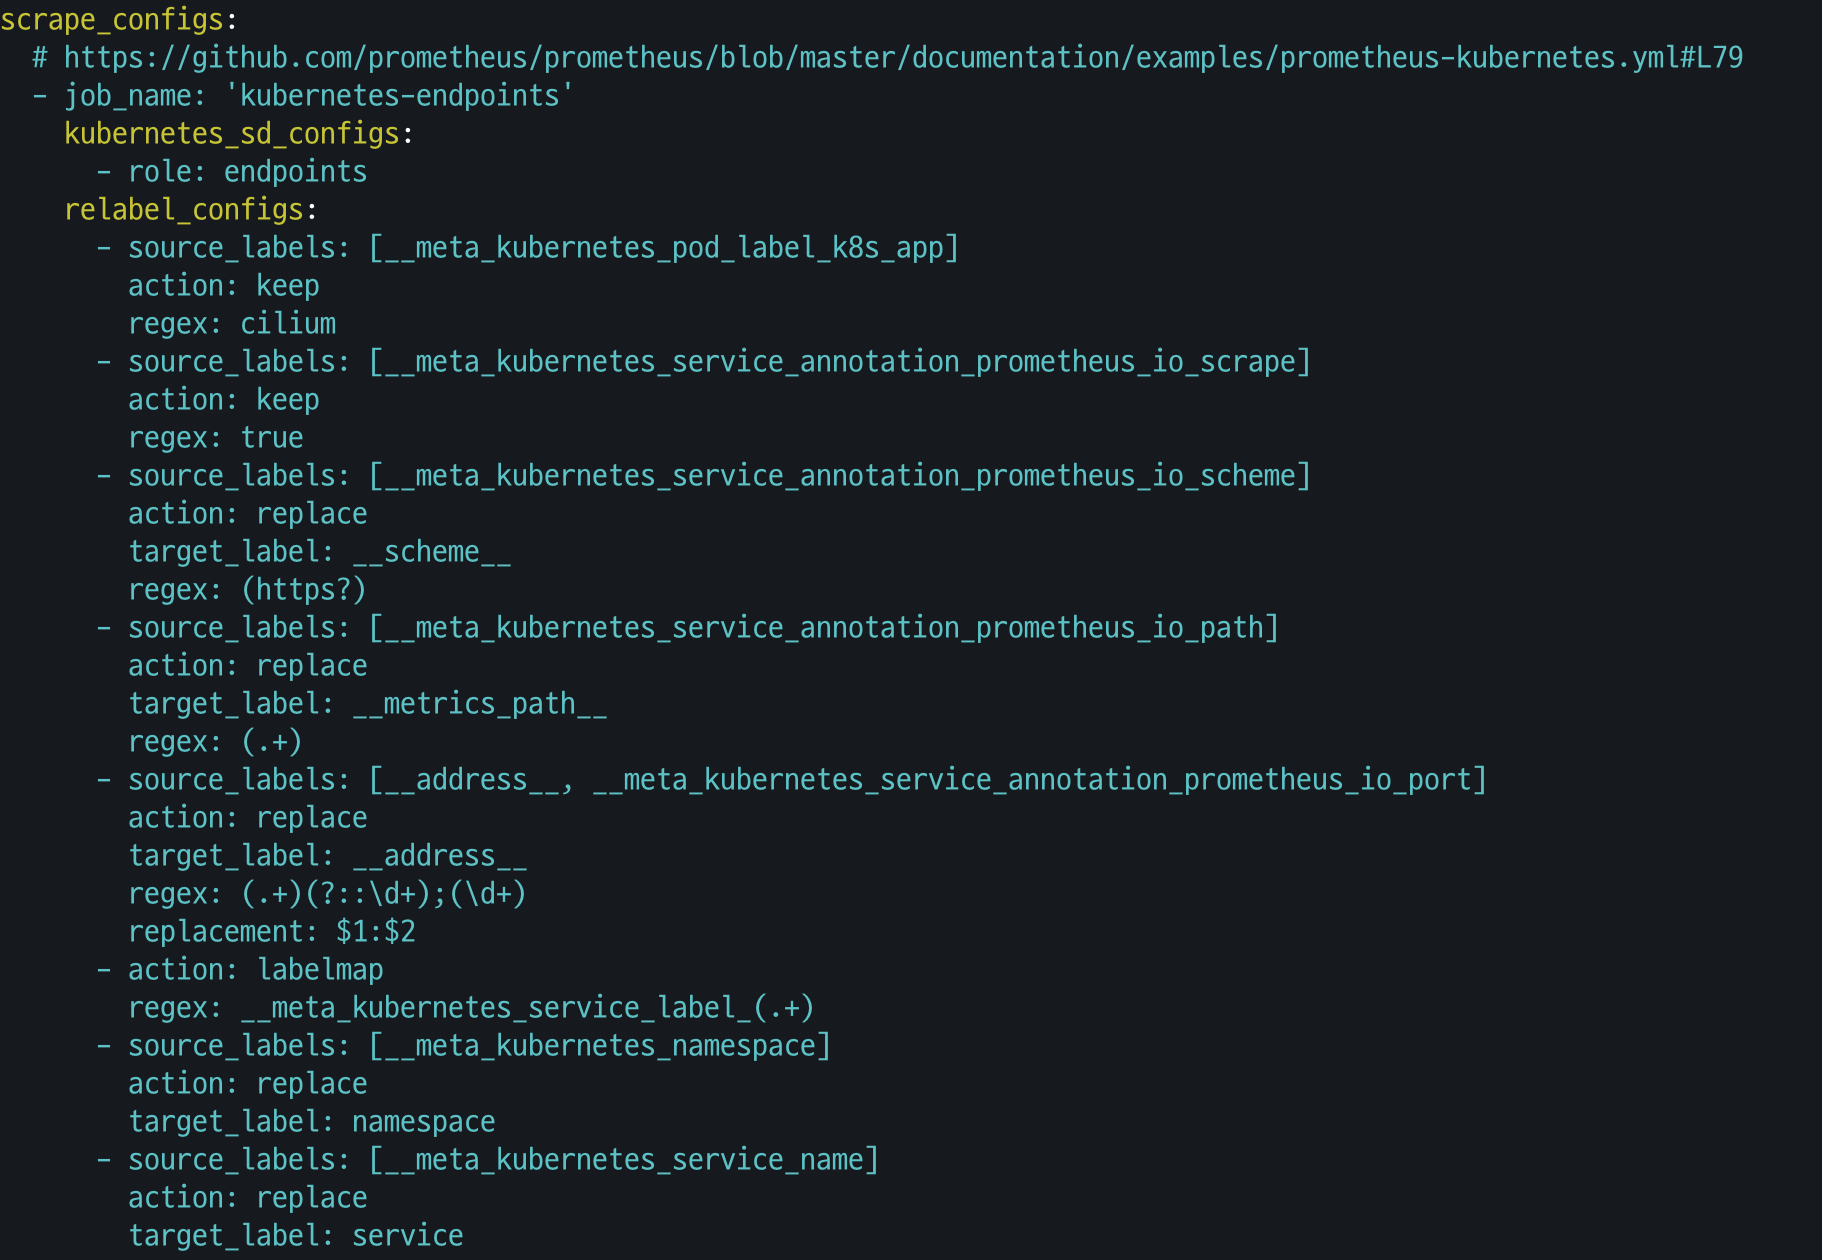
Hubble Metircs 설정 및 수집 방법
Hubble 메트릭은 Cilium이 관리하는 Pod들의 네트워크 동작을 연결 및 보안과 관련하여 모니터링 할 수 있게 해줌
helm install cilium cilium/cilium --version 1.17.6 \
  --namespace kube-system \
  --set prometheus.enabled=true \
  --set operator.prometheus.enabled=true \
  --set hubble.enabled=true \
  --set hubble.metrics.enableOpenMetrics=true \
  --set hubble.metrics.enabled="{dns,drop,tcp,flow,port-distribution,icmp,httpV2:exemplars=true;labelsContext=source_ip\,source_namespace\,source_workload\,destination_ip\,destination_namespace\,destination_workload\,traffic_direction}"
  --set hubble.metrics.port
OpenMetrics
- hubble.metrics.enableOpenMetrics=true를 설정하여 OpenMetrics에 opt-in할 수 있음
- OpenMetrics를 활성화하면 클라이언트가 명시적으로 요청할 때 Hubble metrics endpoint가 OpenMetrics 형식으로 메트릭 내보내기를 지원하도록 구성
- OpenMetrics를 사용하면 Export된 메트릭에 트레이스 ID를 삽입하여 메트릭을 트레이스와 연결할 수 있는 Examplears와 같은 추가 기능을 지원
- Prometheus는 OpenMetrics를 활용하도록 구성해야 하며, Exemplar storage이 활성화된 경우에만 예제를 스크랩
- OpenMetrics는 메트릭 이름과 레이블에 몇 가지 추가 요구 사항을 부과하므로 현재 이 기능은 opt-in 상태, 그러나 모든 허블 메트릭이 OpenMetrics 요구 사항을 준수.
4. Layer 7 Protocol Visibility
- Monitoring Datapath State는 datapath state에 대한 성찰을 제공하지만, 기본적으로 L3/L4 패킷 이벤트에 대한 가시성
- L7 프로토콜 가시성을 원한다면 L7 Cilium Network Policies 을 사용 가능
- L7 트래픽에 대한 가시성을 활성화하려면 L7 규칙을 지정하는 CiliumNetworkPolicy를 생성
- CiliumNetworkPolicy에서 L7 규칙과 일치하는 트래픽 흐름이 Cilium에 표시되므로 최종 사용자에게 노출 될 수 있다.
- L7 네트워크 정책은 가시성을 가능하게 할 뿐만 아니라 포드에 들어오고 나가는 트래픽을 제한한다는 점이 중요
반복 접속
# 반복 접속 해둔 상태
kubectl exec -it curl-pod -- sh -c 'while true; do curl -s webpod | grep Hostname; sleep 1; done'
Cilium Network Policy 생성
# default 네임스페이스에 있는 Pod들의 egress(출방향) 트래픽을 제어하며, L7 HTTP 및 DNS 트래픽에 대한 가시성과 제어를 설정
## method/path 기반 필터링은 안 하지만, HTTP 요청 정보는 Envoy를 통해 기록/관찰됨
## cilium-envoy를 경유하게 됨 (DNS + HTTP 모두 L7 처리 대상)
## 이 정책이 적용되면, 명시된 egress 외의 모든 egress 트래픽은 차단됩니다 (Cilium 정책은 default-deny 모델임)
cat <<EOF | kubectl apply -f -
apiVersion: "cilium.io/v2"
kind: CiliumNetworkPolicy
metadata:
  name: "l7-visibility"
spec:
  endpointSelector:
    matchLabels:
      "k8s:io.kubernetes.pod.namespace": default  # default 네임스페이스 안의 모든 Pod에 대해 egress 정책이 적용
  egress:
  - toPorts:
    - ports:
      - port: "53"
        protocol: ANY  # TCP, UDP 둘 다 허용
      rules:
        dns:
        - matchPattern: "*"  # 모든 도메인 조회 허용, L7 가시성 활성화
  - toEndpoints:
    - matchLabels:
        "k8s:io.kubernetes.pod.namespace": default
    toPorts:
    - ports:
      - port: "80"  # default 다른 파드의 HTTP TCP 80 요청 허용
        protocol: TCP
      - port: "8080"  # default 다른 파드의 HTTP TCP 8080 요청 허용
        protocol: TCP
      rules:
        http: [{}]  # 모든 HTTP 요청을 허용, L7 가시성 활성화
EOF
cnp 확인
kubectl get cnp -o yaml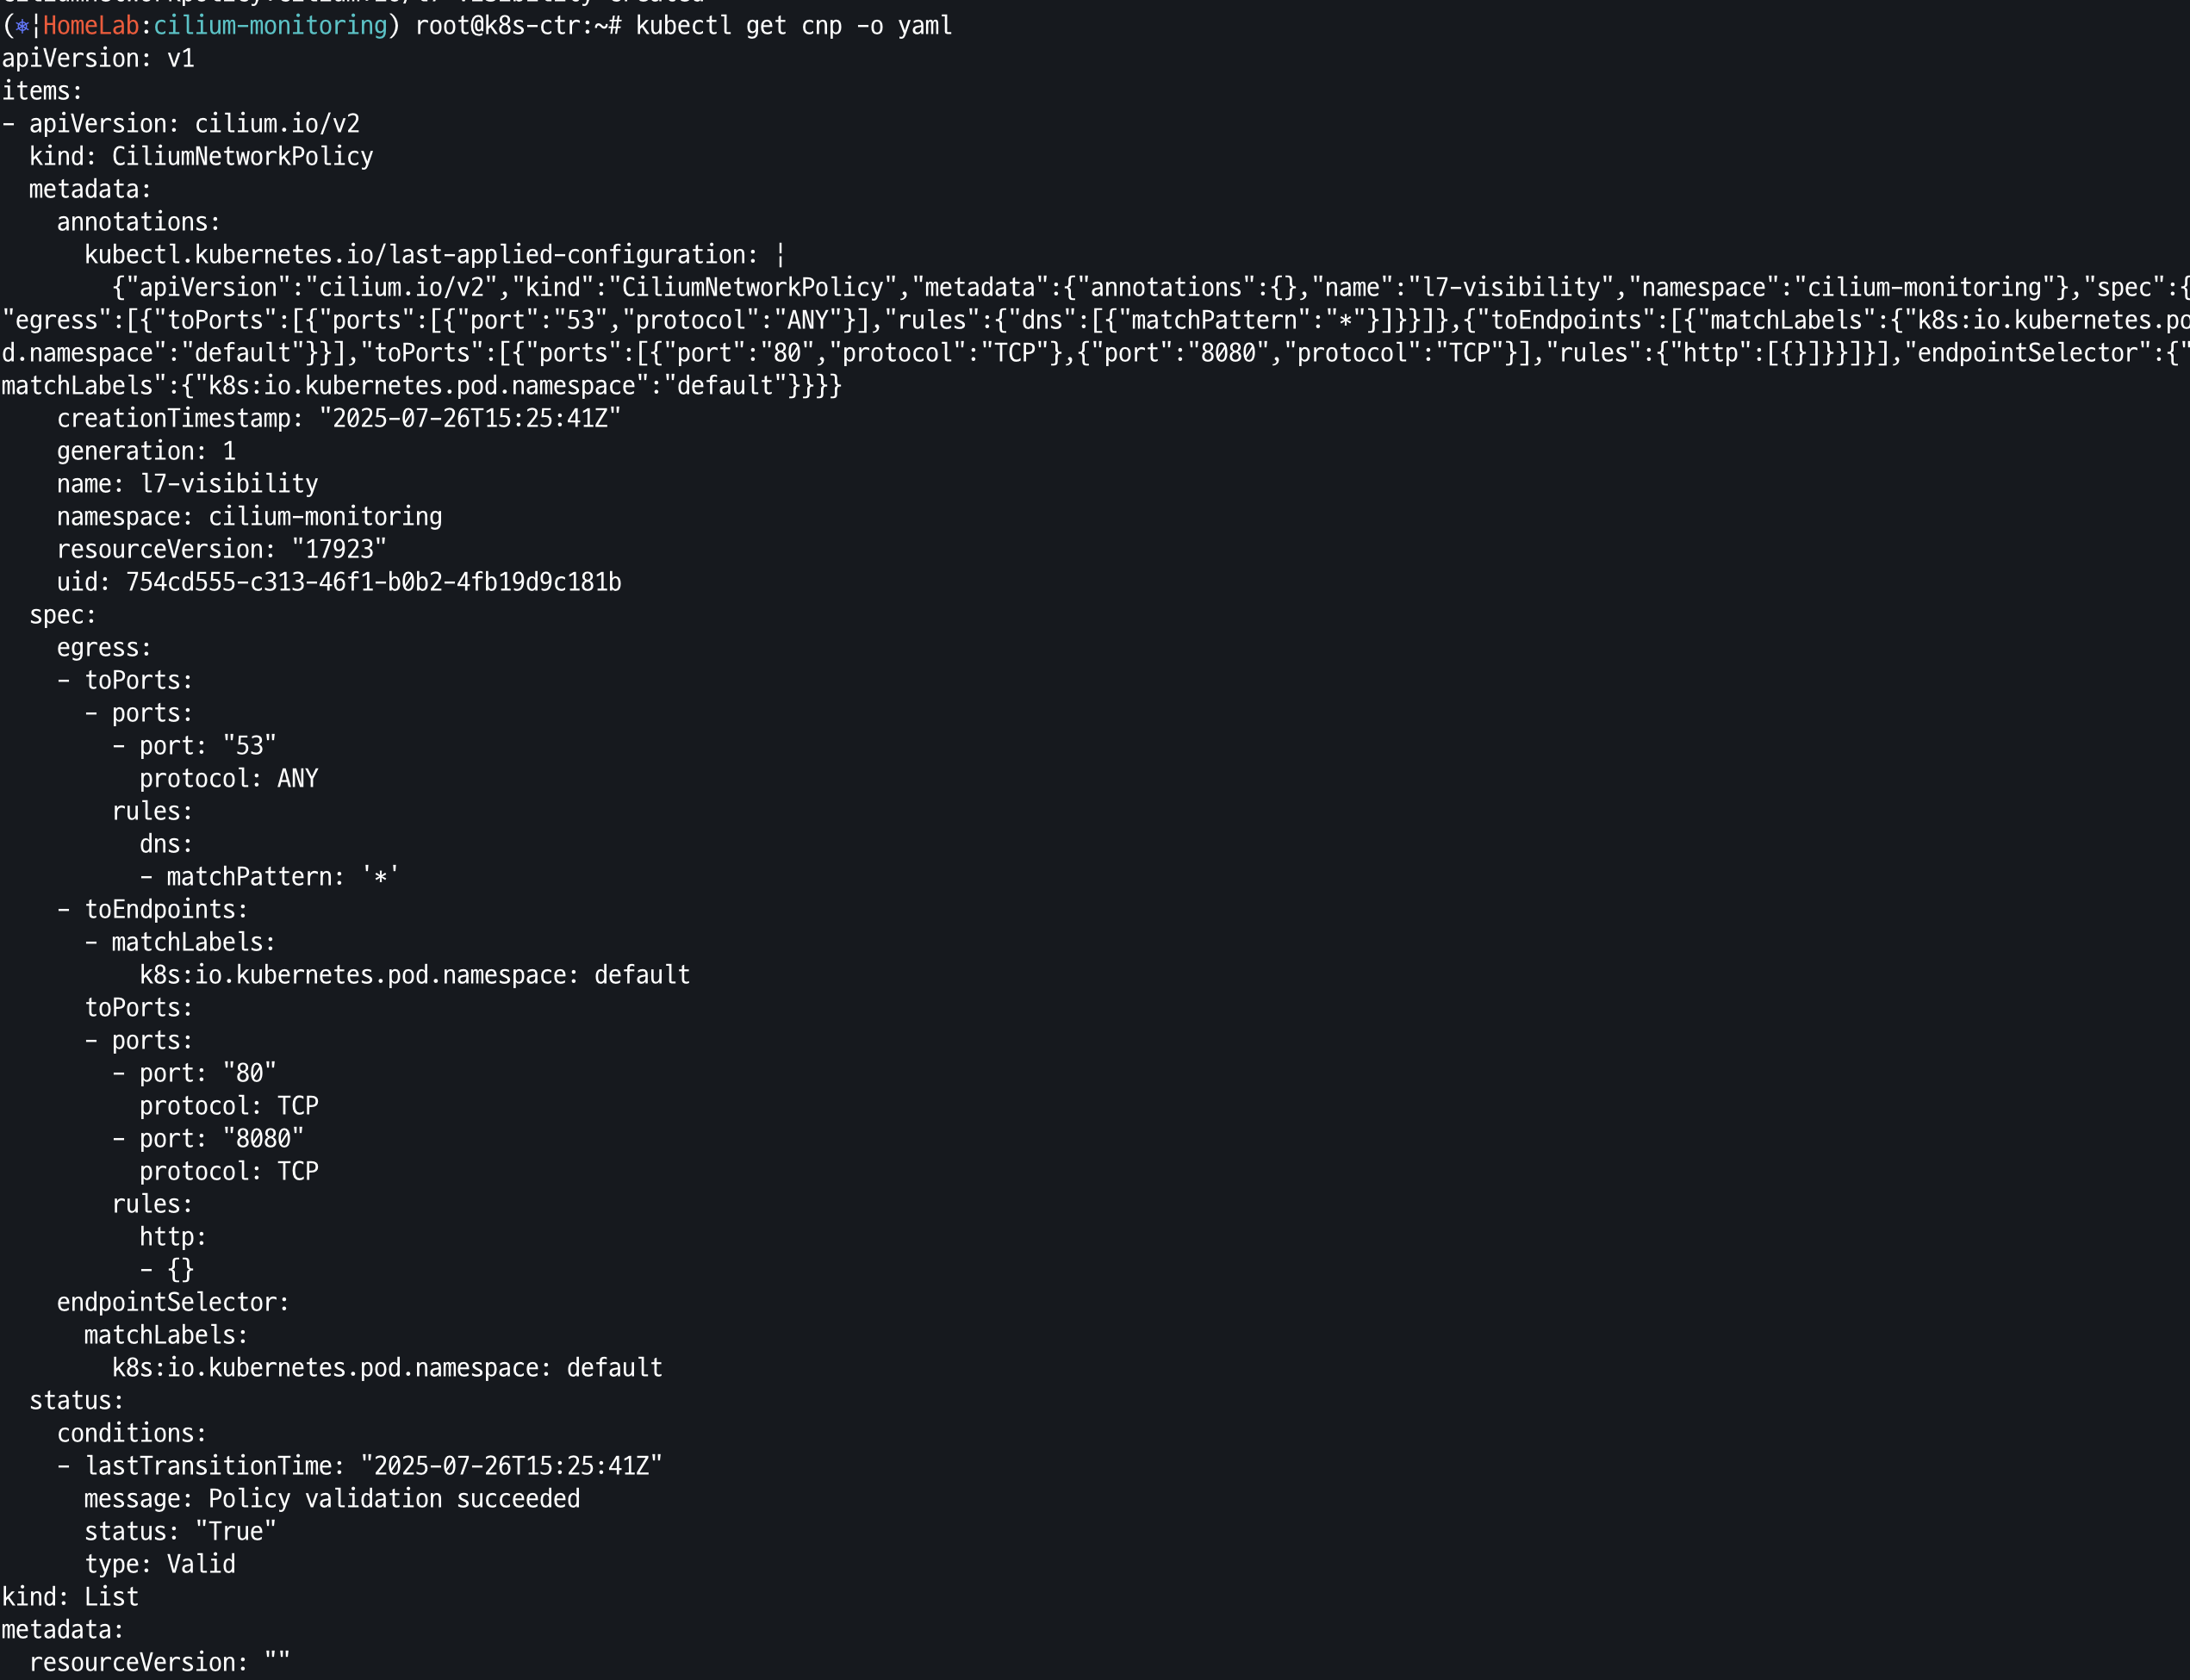
호출 확인 : cilium-envoy 경유
kubectl exec -it curl-pod -- curl -s webpod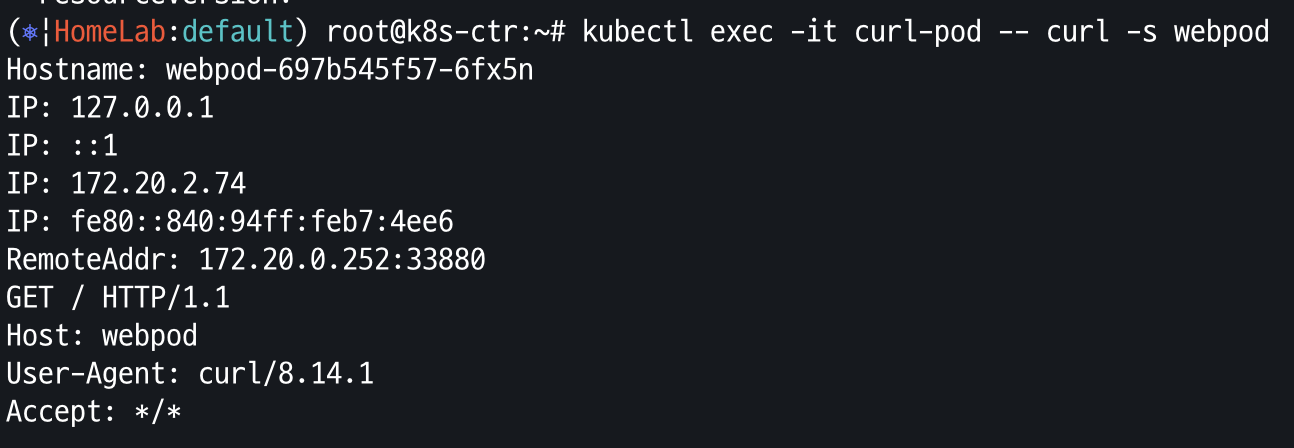
가시성 확인
hubble observe -f -t l7 -o compact
Securit Implications
- Layer 7 트래픽 모니터링에는 민감한 정보를 처리하기 위한 보안고려사항이 포함
민감 정보 가리기
web 앱에서 민감정보 출력확인
kubectl exec -it curl-pod -- sh -c 'curl -s webpod/?user_id=1234'
kubectl exec -it curl-pod -- sh -c 'curl -s webpod/?user_id=1234'
민감정보 미출력 설정
helm upgrade cilium cilium/cilium --namespace kube-system --reuse-values \
  --set extraArgs="{--hubble-redact-enabled,--hubble-redact-http-urlquery}"